To avoid the techy terms, let`s just say that there are few types of Views that you can work with in Ruby.
The first group – Reports or Views – these are the ones that you find in Basic modules, or create off of them. These can be pre and post-filtered, but you cannot enter data into the grid itself. The defaulted Products/Orders/Portfolio etc. views that you see when you first land to a module are also called Pinned Reports. If you need changes to these, please contact our Support Team.
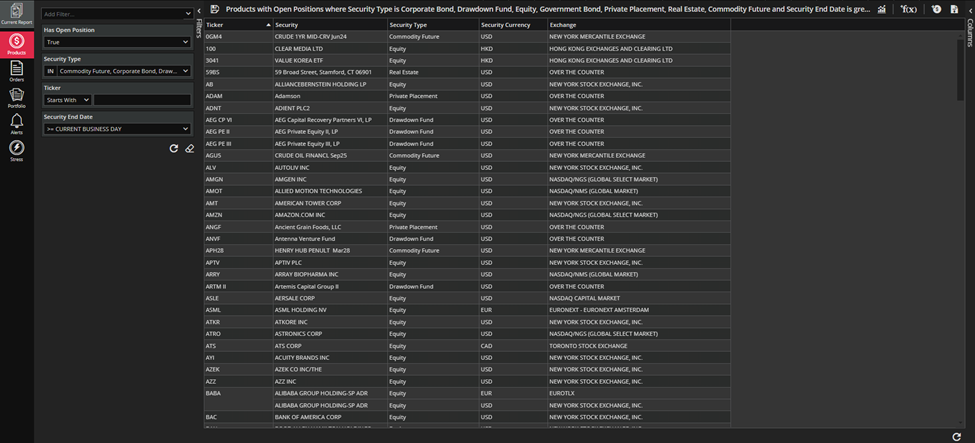
These are divided into three sections: Filters, Grid and Columns. Details of the options will be available in the sections bellow (if not already explained above).
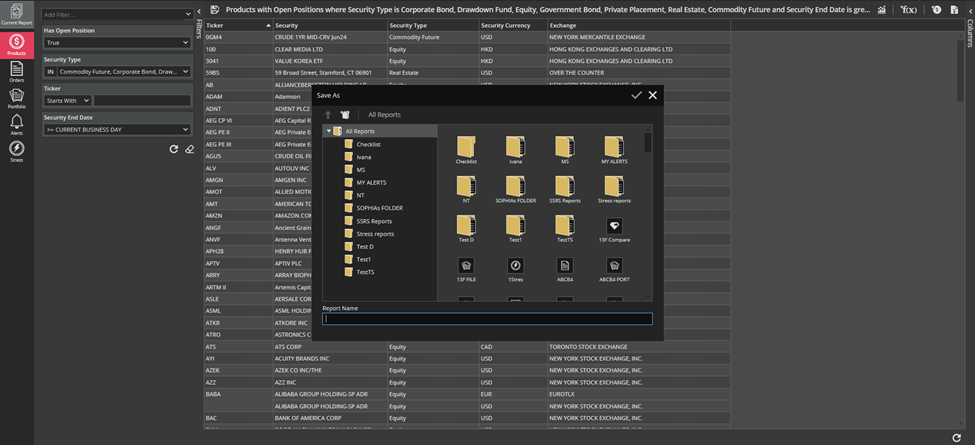
To create your own report, you can start off of any of the Basic modules. Let`s say you started off of Products, you added additional columns, some filtering and now you want to save your report. You can do that by clicking Save As as shown in the screenshot below.
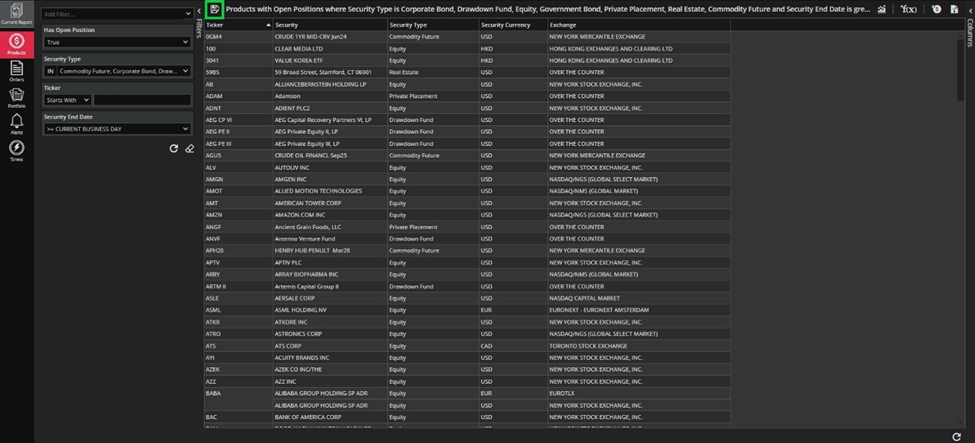
Enter the name and click Save. If you didn`t selected any specific folder, your report is saved in All Reports folder (see All Reports).
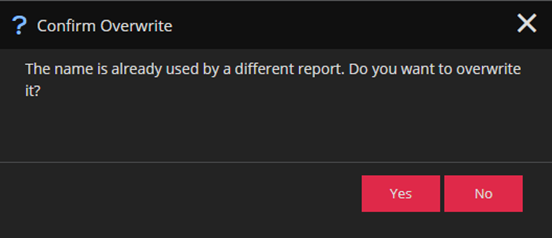
If, by any chance, there already is a report with the same name, Ruby will ask if you want to overwrite it. This is only possible if you are the owner (creator) of the report.
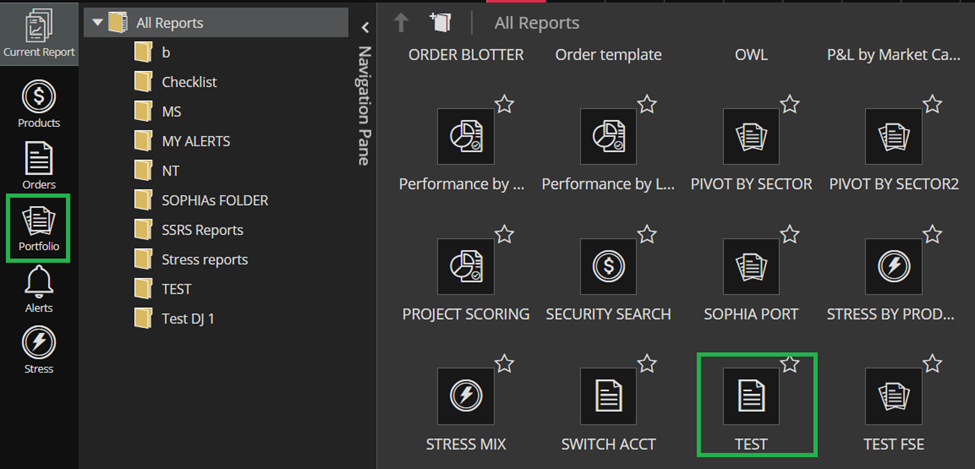
Every report will have icon the same as the icon of the module you created it off of.
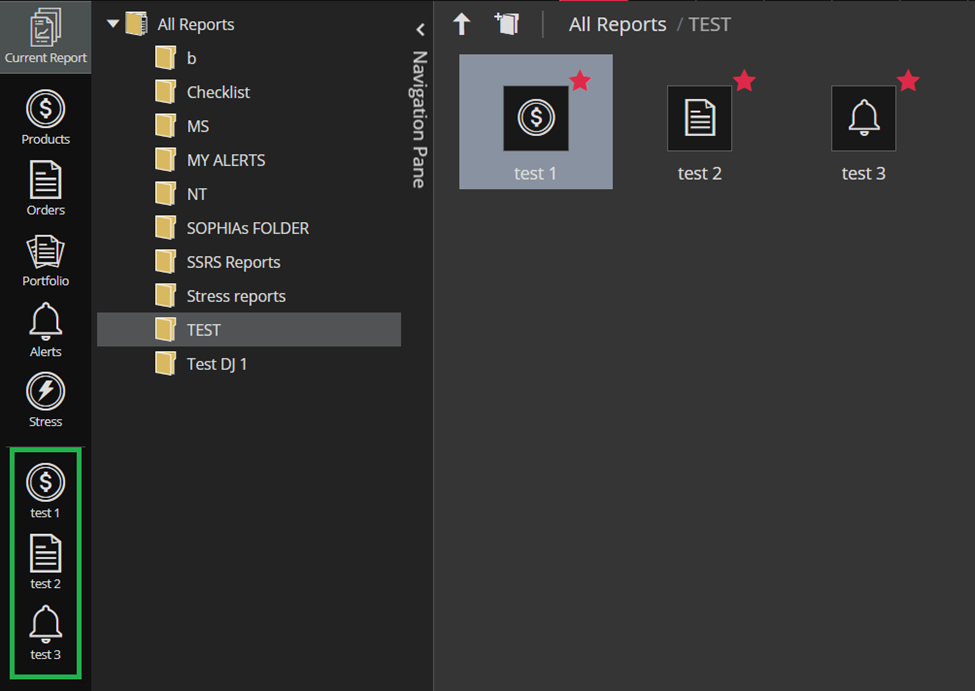
The report you have opened is also shown in the icon on the top of the Basic modules toolbar, marked green in the screenshot bellow. Anyway, if the report is one of your Favorites, it will be shown in the toolbar bellow (see screenshots).
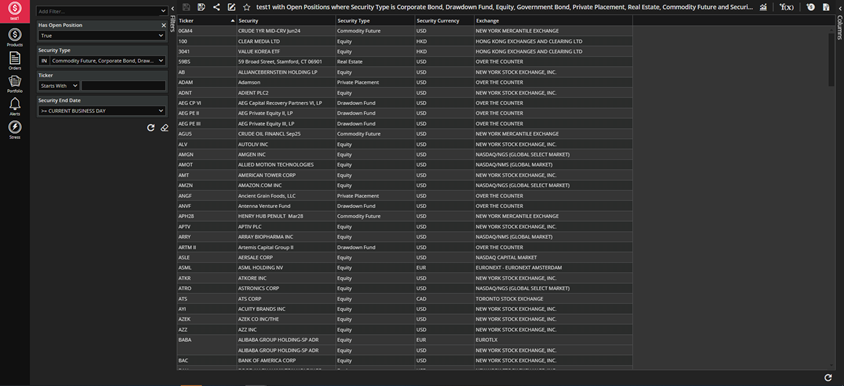
Report`s toolbar will offer you few options: Save, Save As, Share, Rename and Add to Favorites.
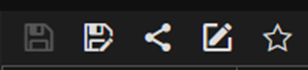
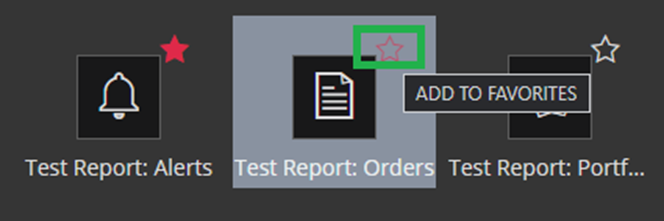
Adding reports to Favorites will add them to the bottom Basic Modules toolbar on the left, so you can easily access them anytime without navigating to All Reports first. Here, you will also be able to sort them as you like by right clicking on report in the toolbar (see screenshots below).
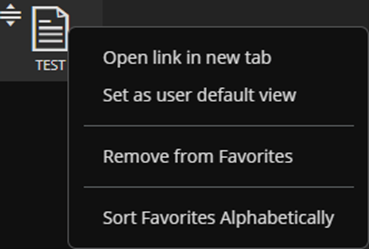
If you choose the Set as user default view option – the next time you log in to RUBY you will be redirected to the chosen report. Note that only the dashboard and gridview reports can be set for the default.
If you want to set another report as default, you just need to open that report and choose Set as user default by right-clicking in the left navigation menu.
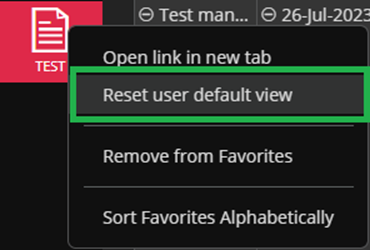
In the case when you don’t want to have a default report at all – you just choose Reset user default view option from the right-click menu in the left navigation menu.
You can also add report to favorites by clicking on the star icon.
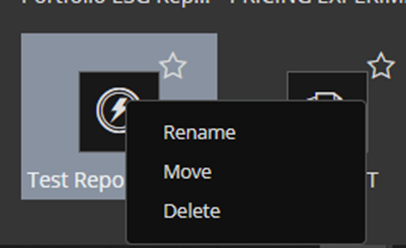
If you right-click the report in All Reports folder, it will offer you three actions: Rename, Move and Delete. You cannot perform any of these if you are not creator (owner) of the report.
Working with folders is explained in All Reports.
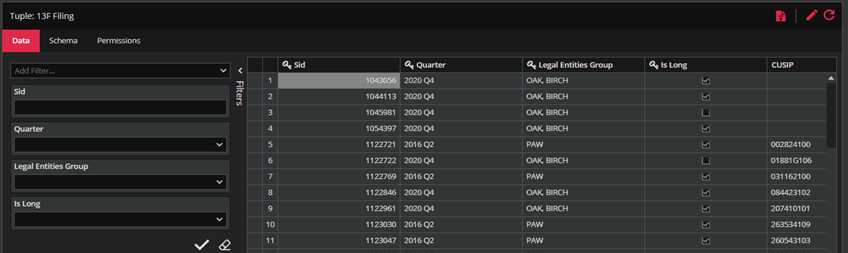
Now, we also have grids in modules such is Tuple Space. These can be edited to enter additional data, but post-filtering is not supported.
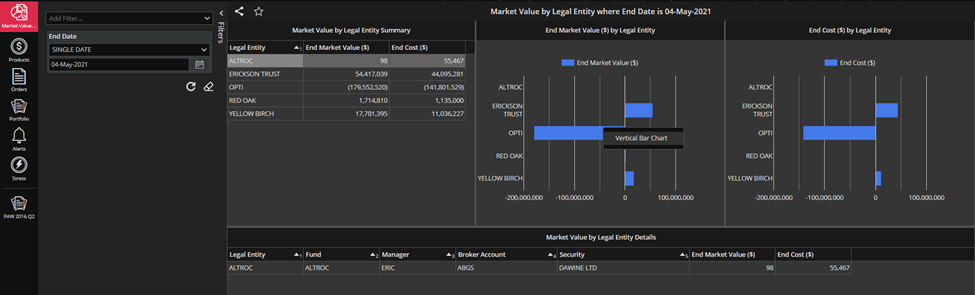
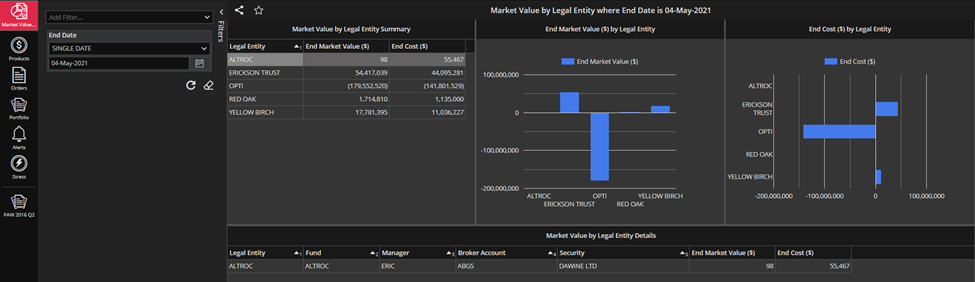
Further, we have Dashboard Reports, created by developers as per client request to show specific data in using Charting and Grids. These are also non-editable by the user. The only thing that user can do is to resize the Dashboard sections by mouse dragging on border between sections and to add/remove columns in the grid.
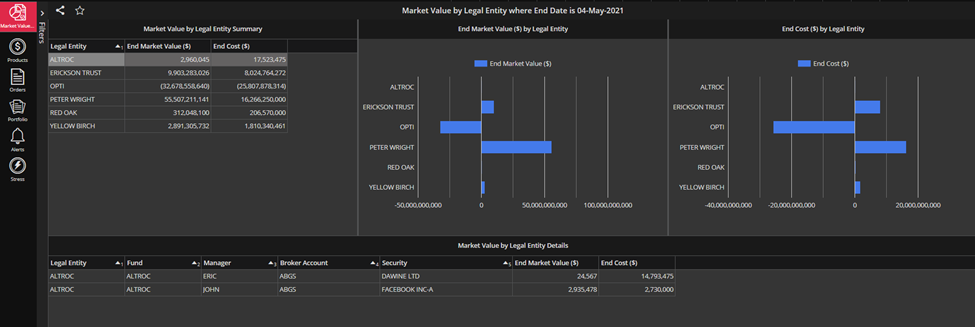
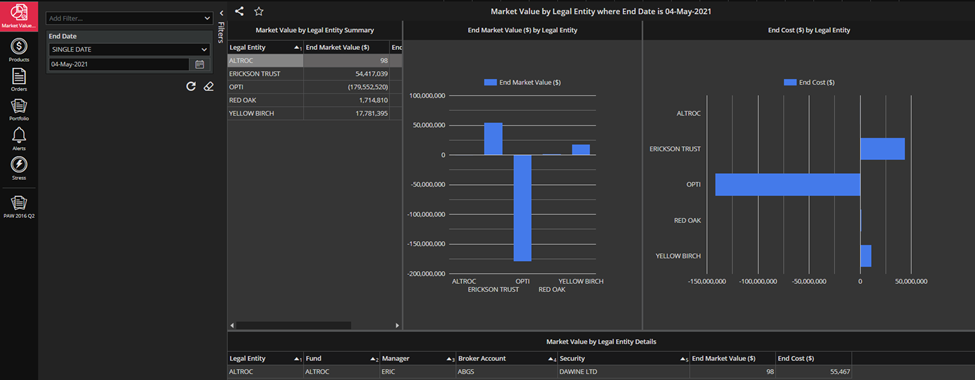
Also there is an option to change chart type by using action from the right-click menu on the chart area (see screenshots below).