Grid Editors can appear in two ways – as a built-in curtain to the right side of the view (Columns curtain), and this is in Basic Modules; and to pop-up as a window by choosing Grid Editor option from the right-click menu in: Executions grid in ETL`s History tab, Securities Preview and Next 10 Runs grids in Scheduled Tasks in Valuation module, Compliance grid and in Dashboards.
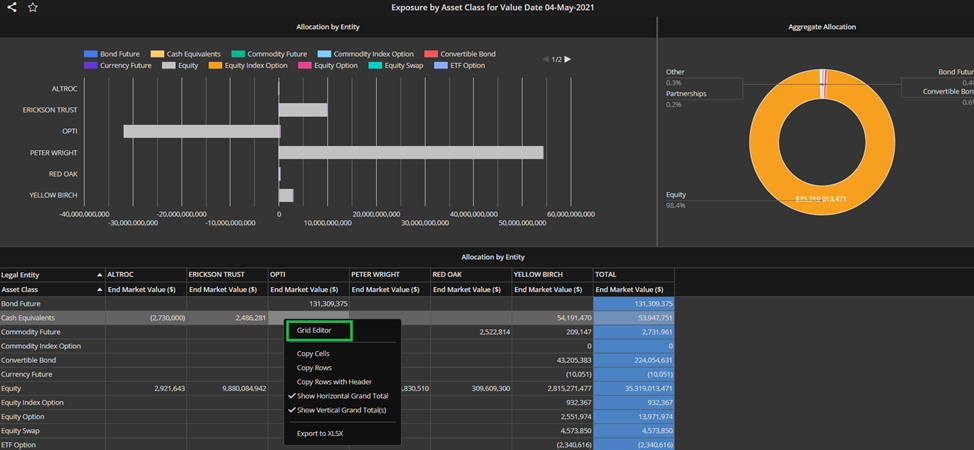
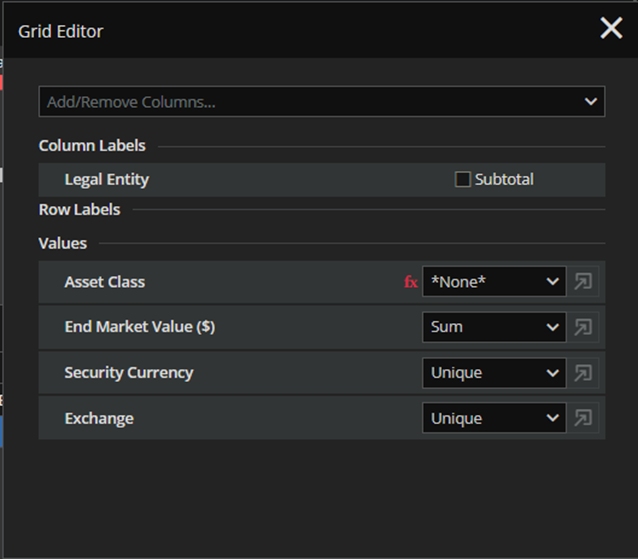
Grid Editor as a pop up and the built-in one (Columns) works the same way, except the fact that you cannot create new calculated columns from a pop-up form Grid Editor.
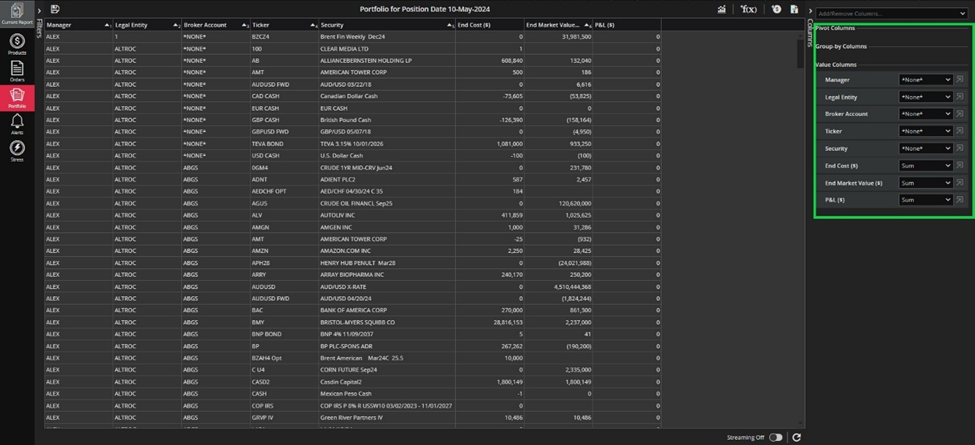
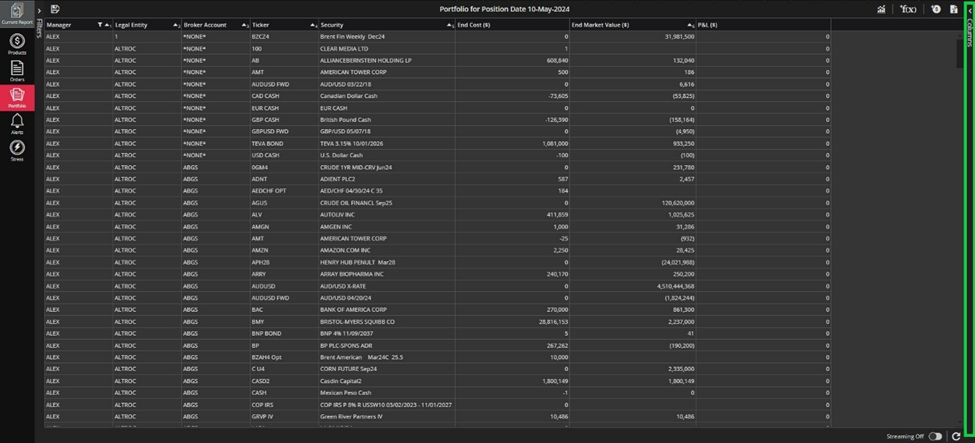
It can be expanded or collapsed by clicking the Columns as shown in the screenshot below. The state of the curtain is saved with the report – meaning that, if the Columns curtain was collapsed when you saved report – it will be collapsed when you open it next time.
Columns curtain has three sections: Pivot Columns, Group-by Columns and Value Columns. You drag and drop columns in and out of these when you want to create either Pivot/Grouping or Flat View.
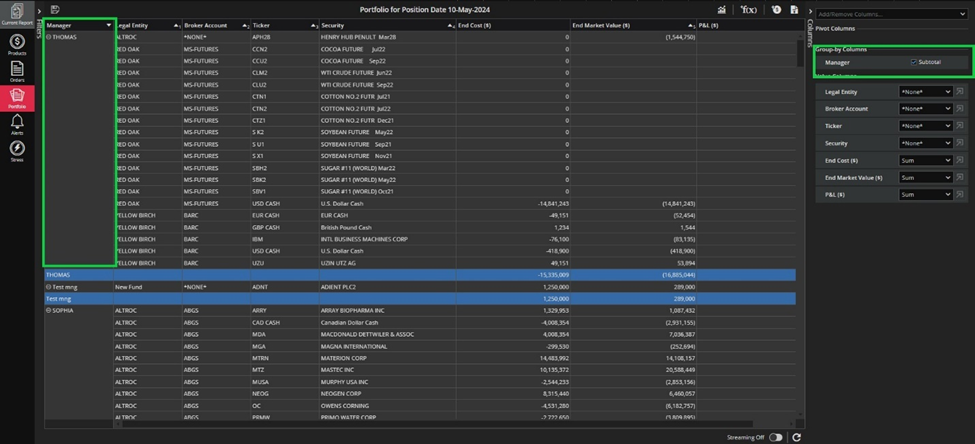
Example of the view when you have one column in Group-by Columns (Grouping part) and the Subtotal option is on.
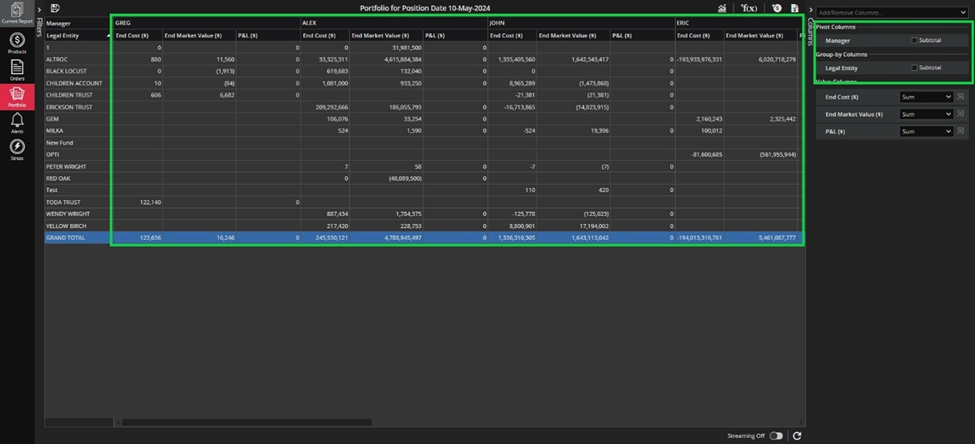
Example of the Pivoting view with the Subtotal on the Pivoting Column is on.
For adding new columns click on the Add Column drop-down as shown in the screenshot below. You have the option to pick multiple columns to be added to the Values section and also to remove them. Multi-select is supported from the keyboard too (shift key).
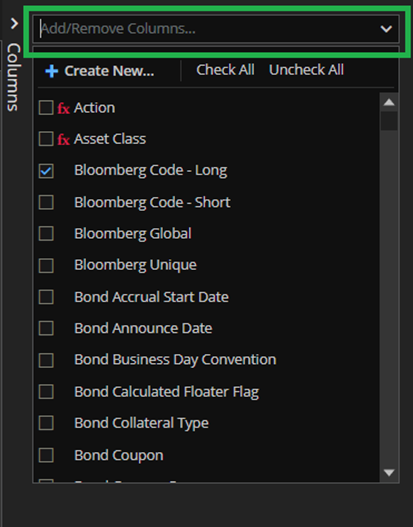
The user can perform search directly from the Search box even though the dropdown is not expanded.
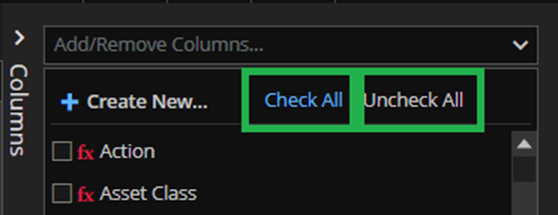
There are actions Check All and Uncheck All marked green in the screenshot below. By performing these actions, you add and remove all columns from the grid-view, in that order.
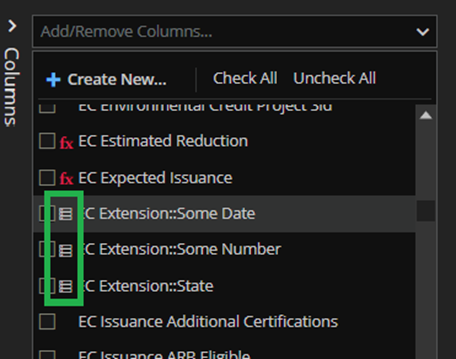
If the columns are marked with the white icon (see screenshot bellow), that means that it is a tuple-based column.
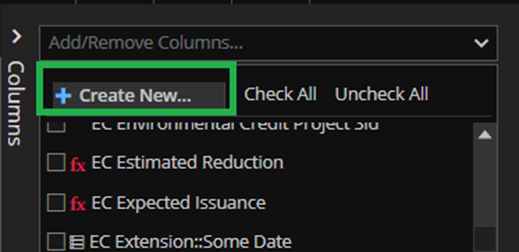
From the same menu, you can create a calculated column by clicking on the Create New as shown below.
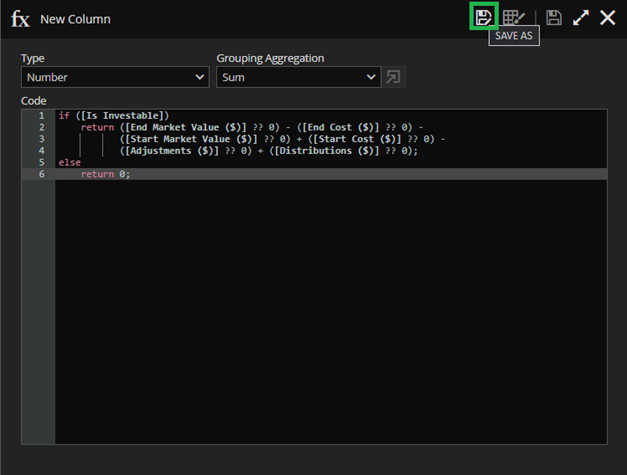
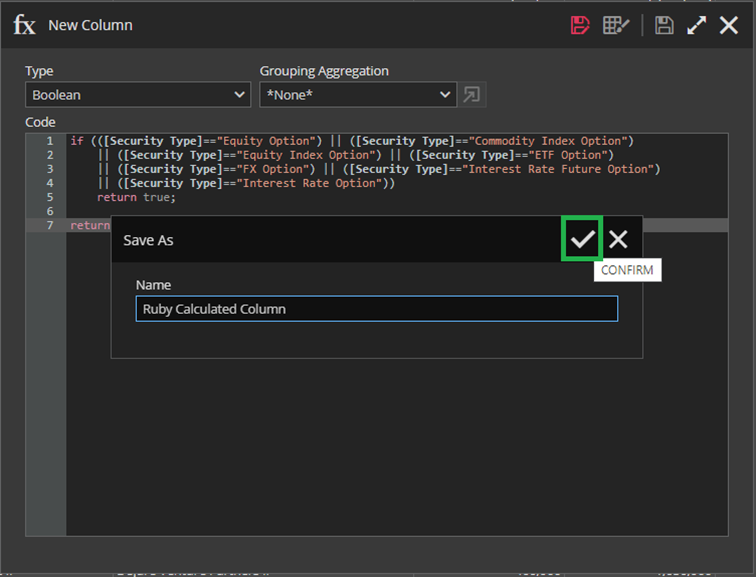
After you entered code, click the Save As to save your calculated column, fill in the Name and click Confirm.
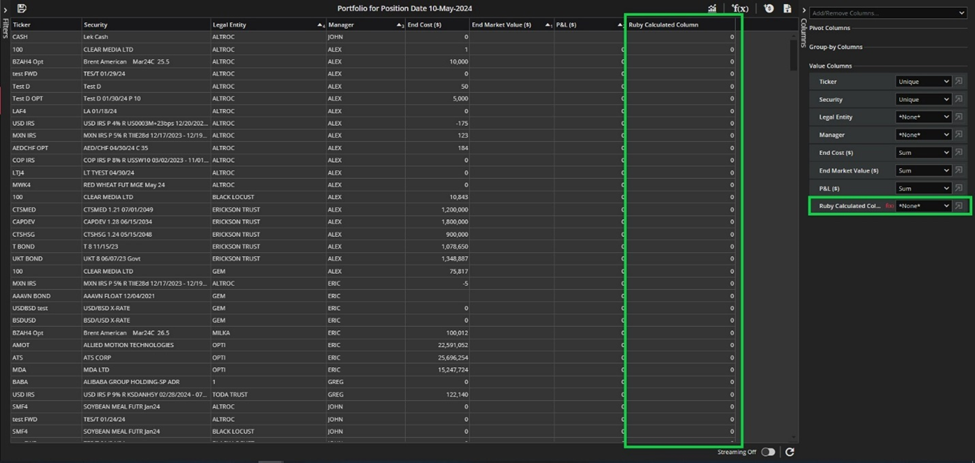
The column will be automatically added to the Value Columns Section.
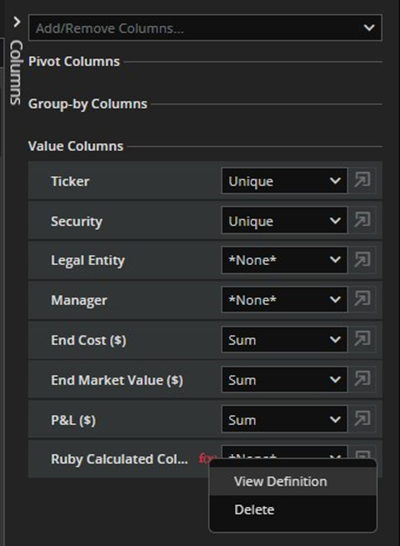
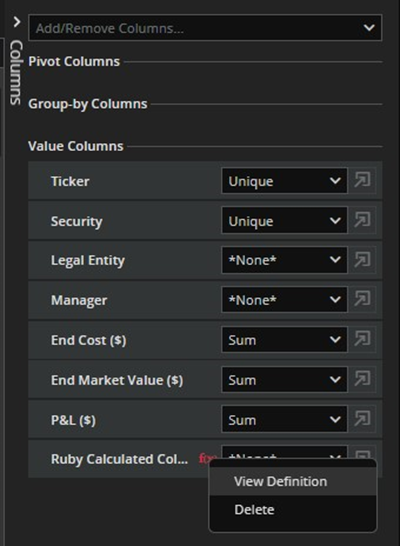
If you right-click on the calculated column, you will have the option to either View Definition of the column, or to Delete it. Definition of the column is also available if you click the red ‘fx’ icon on the right.
If you would just want to remove the column from the view, hover over the column in the grid editor and the ‘X’ will appear in front of the column`s name. By clicking it, the column will just be excluded from the view, but not deleted.
To change the order of the columns, you can: drag and drop the column in the Grid Editor, drag the column from Grid Editor and then drop it directly in the view, or drag and drop columns in the view directly.
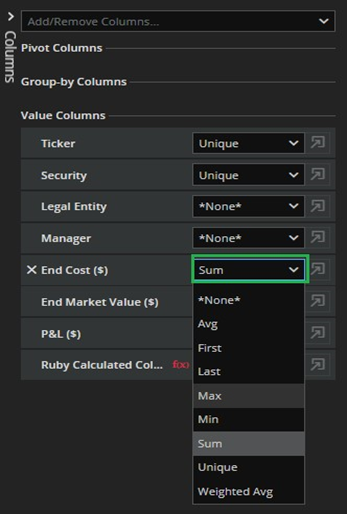
To change column`s aggregation, click on the Aggregation dropdown, show in the screenshot. Offered aggregations depend on the type of the column and thus, you might be seeing fewer options in this dropdown for different columns. Setting Aggregation is also possible from column`s header.
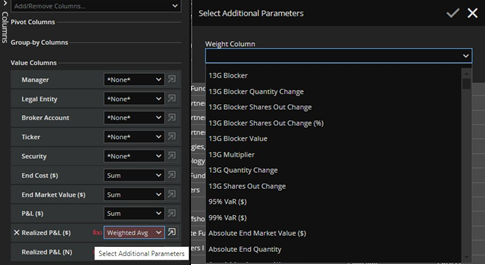
If you chose Weighted Average for number type columns, you will need to provide additional parameters and provide Weight Column.
If the Weighted column is chosen – the tool-tip will be showing the name of the Weighted column.
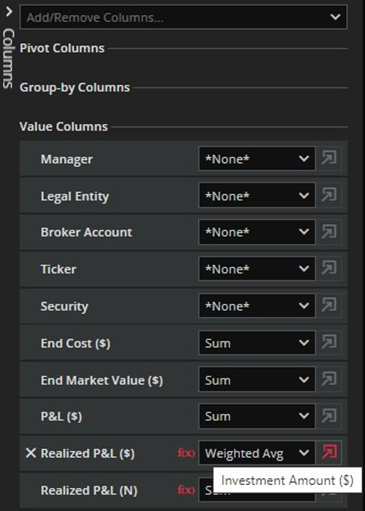
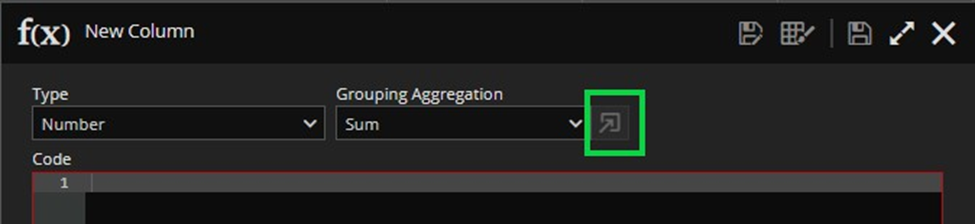
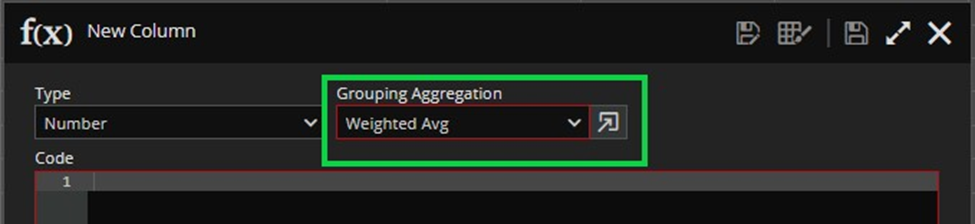
The same behavior is also available in the Calculated Column form. The button for setting parameters is only enabled when the Weighted Avg is chosen.